Part one
A city drawn before it was built
Islamabad is unusual among the world’s capitals: it was drawn on paper before it existed. At the end of the 1950s, Pakistan decided to build itself a brand-new capital at the foot of the Margalla Hills. A Greek planner named Constantinos Doxiadis laid it out in 1960 as a calm grid of lettered sectors — the F-10s and G-11s people live in today.
Green space was not an afterthought in that drawing. It was part of the structure. Wide planted strips were drawn along the avenues, and the hills to the north were left alone. The green you see from a car window in Islamabad is not leftover land. Someone drew it there, on purpose, before a single house existed.
This story is about what happened to that drawing.
Part two
The promise of 1980
In April 1980, the government made a big promise. It declared the Margalla Hills a national park — the strongest protection land can get in Pakistan.
But here is the detail almost everyone gets wrong: the park was never only the hills.
The legal boundary drawn in 1980 has three parts. The hills, yes. But also Rawal Lake and all the land within two kilometres of it, and Shakarparian, the wooded rise near the city centre. The law also deliberately included sixteen villages whose people were already living there — places like Saidpur and Noorpur Shahan. Their homes are lawful, and they are inside the park.
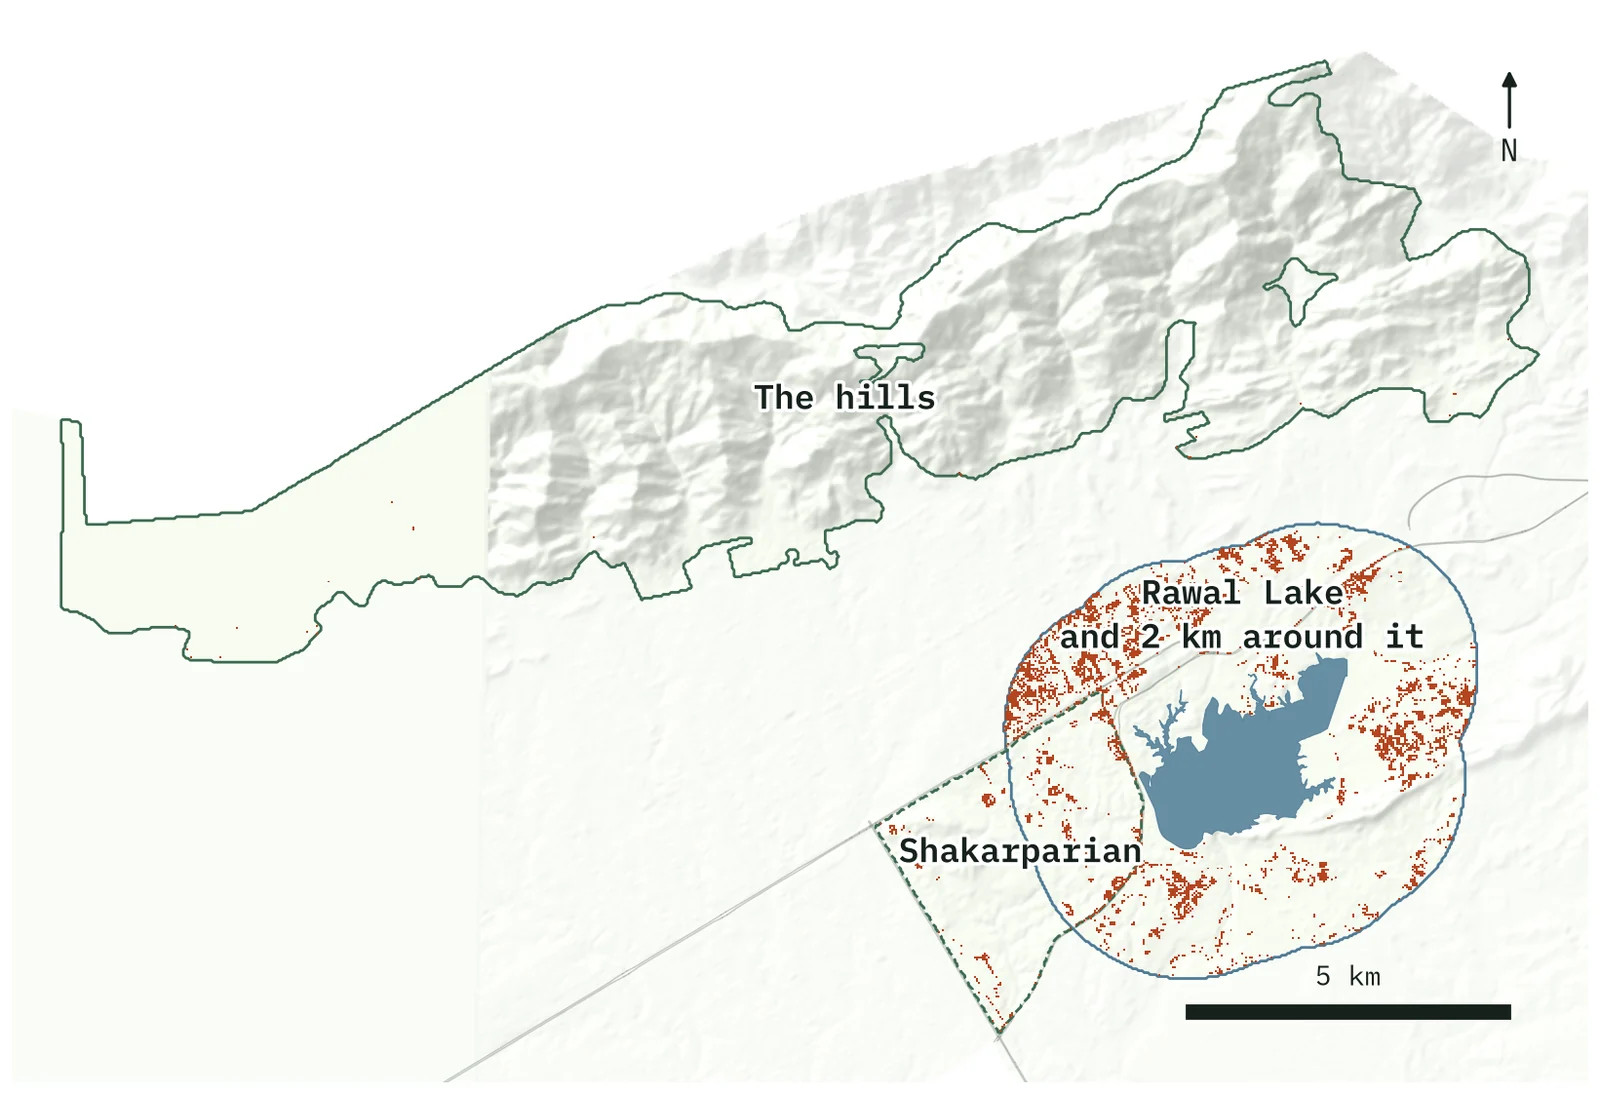
Keep that picture in mind. Most maps — including the popular ones on your phone — draw only the hills as the park. The low ground around the lake, where the protection matters most, is usually not drawn at all. That mistake will come back later in the story.
Part three
The sky keeps a diary
Since 1987, scientific satellites have photographed Islamabad regularly, and the pictures are free for anyone to use. Think of it as a diary the sky has been keeping: one clear entry per year, every year, for thirty-five years and counting.
For this study, the diary was read one page at a time. The territory was divided into small squares, each 30 metres on a side — about the size of two basketball courts — and every square was tracked through every year. The picture for each year is taken in the same season — the clear months after the summer monsoon — so a year is always compared with the same time of year.
One rule keeps the whole thing honest. A square only counts as “newly built” if it changes and then stays changed for four years in a row. A dry season, a harvest, a dusty year — none of those can fake a building, because none of them lasts four years and then never goes back.
A real building goes up in 2005
Counted, and dated to 2005 — it changed, and stayed changed.
A dry, dusty 2007
Ignored — it read as built for one year, then went back.
The diary was then cross-examined. Its answers were checked against half a million building outlines traced from much sharper images, against a re-run of the whole method at three times the detail, and against a second set of pictures taken six months apart. Where a check disagreed, the answer was corrected, not defended.
One question always comes up here: why not simply use the satellite view in a map app? Because those pictures are made for finding your way, not for measuring. They are stitched together from different years, carry no dates, and their terms of use forbid this kind of analysis. The scientific archives are plainer to look at — but every picture in them is dated, calibrated, and free for anyone to check.
The technical details · how the diary is read
The record is USGS Landsat (missions 5 to 9, 1987–2025), with Sentinel-2 alongside from 2016, read as one cloud-free composite per year from the clear months after the monsoon — so every year is compared in the same season. The territory is a grid of 30-metre cells; each cell’s greenness (NDVI and related indices) feeds a land-cover classifier, and it is the cell’s year-by-year trajectory, never a single image, that decides whether and when it converted.
A conversion is dated to the first year of a run in which the cell reads as built and stays that way for four consecutive yearly composites. One-year excursions — drought, harvest, dust — fail the persistence test and are discarded.
Part four
What the diary shows
Add up thirty-five years of diary pages, and the total reads like this:
Between 1987 and 2022, Islamabad turned somewhere between 96 and 131 square kilometres of open land into buildings.
Numbers that size are hard to feel, so compare it to something: the entire Margalla Hills National Park is 174 square kilometres. The city has built over an area between half and three-quarters the size of its whole national park — in one working lifetime.
A word about the numbers before going further: every figure in this story is a range, not one number, and that is deliberate. There is no single correct moment at which a patch of ground “becomes” a building, so several fair cut-offs were tried — and the range is what they all agree on. A single tidy number would be hiding that choice.
And here is where it happened:
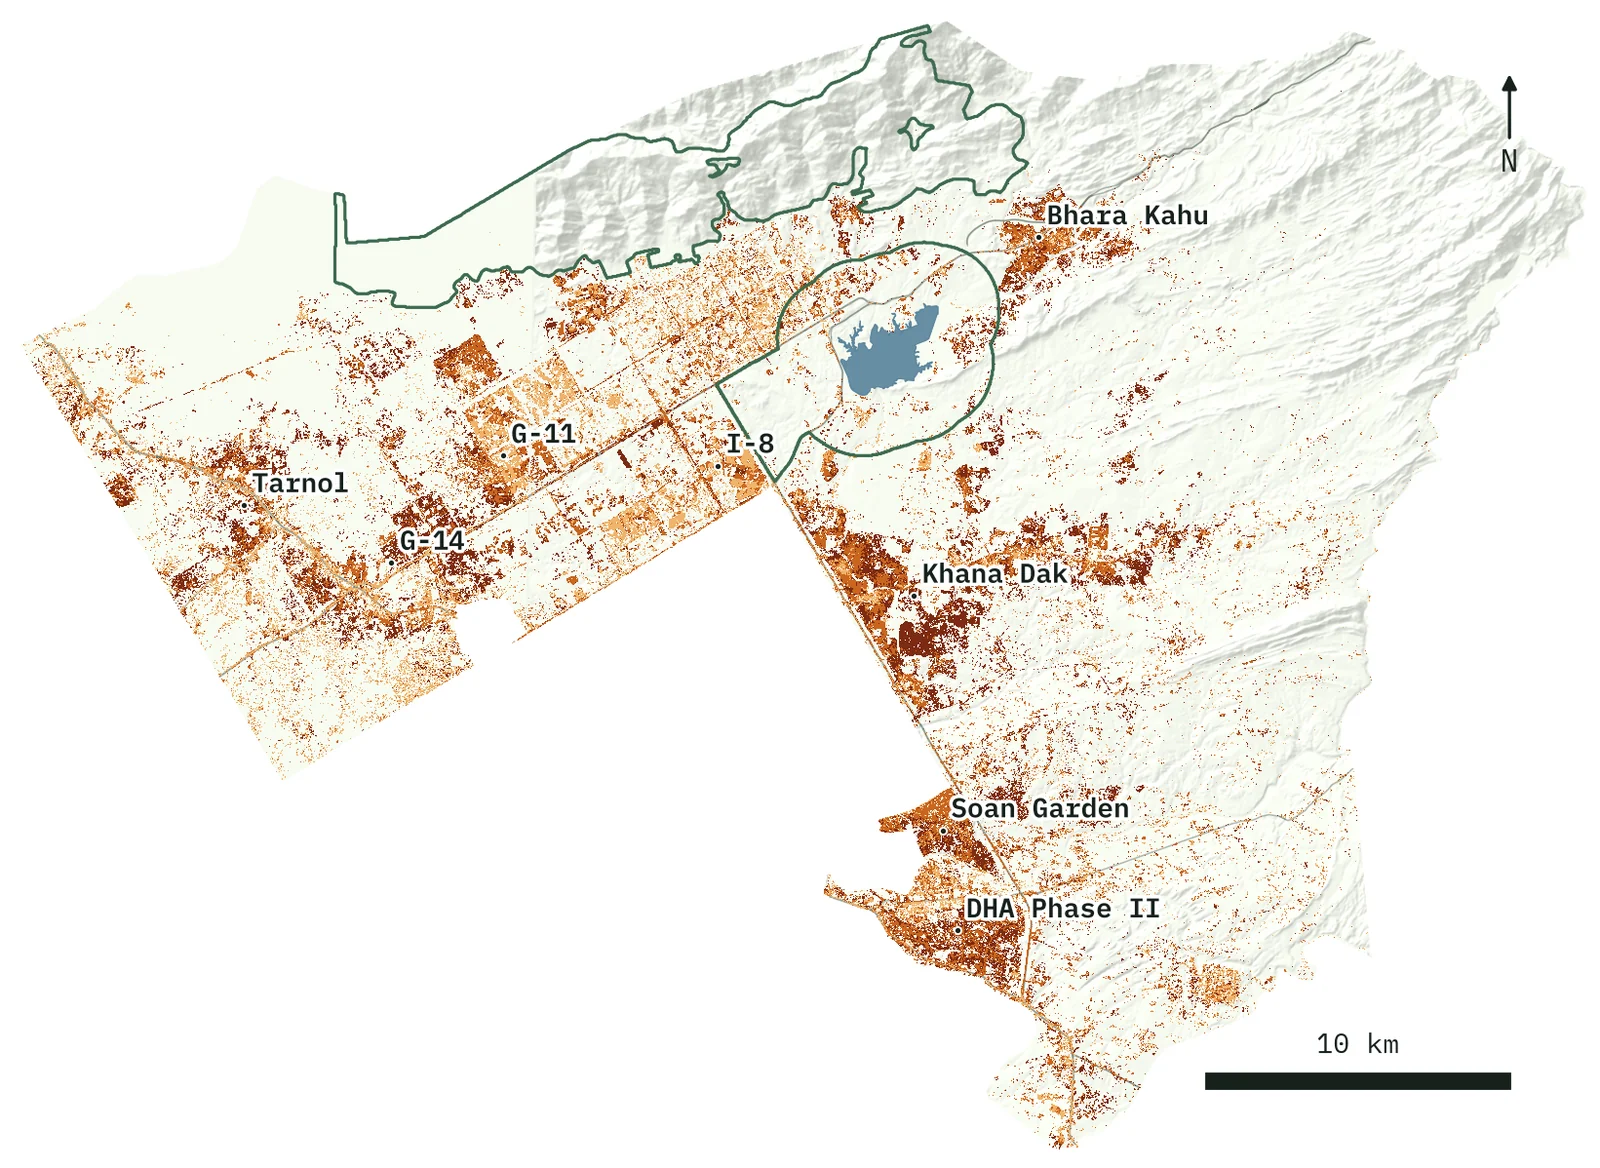
The building did not creep evenly outward. It landed in big, recognisable pieces: housing schemes like DHA Phase II and Soan Garden in the south, new sectors like G-14 and G-11 in the west, the growth around Bhara Kahu in the east, and the largest single patch of all near Khana Dak — on its own, that one patch is up to 15 square kilometres, bigger than some entire sectors.
Meanwhile, inside the park’s boundary, the same thirty-five years added somewhere between 2.7 and 4 square kilometres. The city out-built its park about thirty times over. The park is where the law is clearest. It is not where the building went.
The technical details · where 96–131 km² comes from
Nine dating rules were run, crossing two strictness levels for “reads as built” (a built probability of 0.7 or 0.8) with three persistence requirements (three years, four years, or none at all). Each rule’s picture of the territory in 2021 was then checked against the 19,970 hectares that an independent 10-metre map (ESA WorldCover) sees standing built that year. Rules that skipped persistence, or that missed the reference by more than 25 per cent, were discarded.
Three rules survive, and they bracket the answer: 9,566, 11,569 and 13,127 hectares of new construction across the territory between 1987 and 2022 — 96 to 131 square kilometres. Inside the notified park, the same three rules find 270, 394 and 399 hectares. Nothing after 2022 is counted, because the four-year window has not yet closed on it.
Part five
The green ribbons beside the roads
Remember the planted strips from the 1960 drawing — the green ribbons along the avenues? The diary can measure those too.
Take every major road in the territory — twenty-one of them — and look at the band of land from 30 to 200 metres either side. Together those bands cover about 60 square kilometres. That is the city’s roadside green, the part of the drawing everyone drives past daily.
About a quarter of it — 12 to 16 square kilometres — is now built over. On some roads, it is nearly two-thirds.
Look at the outlined bar. In December 2024, the federal cabinet decided to narrow the protected corridor along the Srinagar Highway — the one decision about these strips that made the news. But on this measure, the Srinagar Highway is unremarkable: twelve of the twenty-one roads have lost a bigger share of their strip. Whatever is eating the green ribbons, it is not one highway. It is the whole network.
The technical details · how the road strips were measured
Twenty-one named roads, taken from the public street map (OpenStreetMap), each measured only where it runs at least three kilometres. Around each road, the land from 30 to 200 metres out on both sides — 6,043 hectares in all. The first 30 metres is excluded on purpose: a widened carriageway covers its own verge by definition, and that is not the question being asked.
Two easy ways to get this wrong were closed. Where roads meet, their bands overlap, so land at junctions is counted once, not twice — at the highest of the three measures, that correction alone moves the total from 1,722 down to 1,611 hectares. And a road that the map data splits into differently named segments is merged under the name it carries most often, so no road is counted as two.
Part six
Eleven thousand buildings in a national park
Now back to the promise of 1980, and the mistake on the maps.
Counted one by one from very sharp imagery, 11,097 buildings stand inside the national park’s legal boundary today.
At least 767 hectares of the park — more than a thousand football pitches — is built on. Of the change since 1987, 98 to 99 per cent happened in the low ground: around Rawal Lake and at Shakarparian. Exactly the parts of the park most maps never draw.
That is unlikely to be a coincidence. When the popular map on everyone’s phone shows the park as “the hills”, land by the lake gets treated — by buyers, by builders, sometimes by officials — as ordinary land. The courts have not treated it that way: in 2022 the Islamabad High Court ruled that even a golf course built by the Navy stood on park land, and ordered it sealed.
A building inside the boundary is not automatically a crime — the sixteen villages are the proof of that. But every one of those 11,097 buildings stands on land where a national park’s rules apply, whether or not anyone drew it green.
The technical details · the park’s three numbers
The 11,097 comes from building outlines traced from imagery sharp enough to show individual roofs — Microsoft’s and Google’s open research datasets, 502,954 outlines across the territory — intersected with the park boundary as reconstructed from the 1980 notification.
The 767 hectares is a different instrument agreeing: ESA’s independent 10-metre WorldCover map finds that much standing built ground inside the Rawal Lake component alone, and the other components only add to it — which is why the story says “at least”. The 98-to-99-per-cent split of the dated change since 1987 (about 382 hectares around Rawal Lake, 45 at Shakarparian, roughly 2 in the hills, on the highest of the three measures) comes from the long record itself. The golf-course ruling is Islamabad High Court, W.P. 4245/2014.
Part seven
The quiet hills are not quiet
So the hills themselves are fine? That is what the diary seems to say at first: in thirty-five years, the hills register only a few hectares of change. This study nearly wrote that down as “the ridge is untouched”. It would have been wrong twice.
First: sharper imagery, which can see individual rooftops, finds 1,296 structures standing on the ridge. They are small, scattered houses — each one too small for the yearly satellite pictures to notice, all of them there.
Second: between 2016 and 2023, the ridge gained new building faster than anywhere else in Islamabad — 66.5 per cent more building-carrying ground, against a citywide background of about 11 per cent.
In absolute terms it is still small — hectares, not square kilometres. But the direction is unmistakable, and it is fastest precisely where everyone believes nothing is happening.
The technical details · the ridge numbers
The 1,296 structures come from the same traced building outlines. The growth rate comes from a different instrument again: Google’s Open Buildings 2.5D series, which estimates building presence at 4-metre detail for every year from 2016 to 2023. On the ridge, ground carrying buildings grew by about 13 hectares in those eight years — a rise of 66.5 per cent on what stood there in 2016 — against about 62 hectares (+11.4 per cent) in the lowland zones measured alongside it. The yearly 30-metre record sees almost none of this, because scattered single houses sit far below its size threshold; that is exactly why the sharper series was brought in.
Part eight
The half the satellite cannot see
Before this story ends, you need to know why every number in it is a minimum.
The long satellite diary sees the ground in 30-metre squares, and a square only registers as “built” when roughly a third of it is under roof. A house or two in a big square simply does not tip the scale.
Real buildings, invisible to the record.
Only dense building tips the scale.
When the diary was checked against half a million individually mapped buildings, 51 per cent of the buildings inside the national park stood on land the diary had never once recorded as built.
Scattered houses along a road — exactly the pattern in the green strips and on the ridge — are what slip through. So read every figure in this story as a floor, not a total. Wherever it was possible to check, the real amount of building was roughly double what the long record shows.
The technical details · sizing the undercount
Two independent checks. First, the half million traced outlines: 51 per cent of the building outlines inside the park stand on cells the yearly record never once flagged as built. Second, the whole pipeline was re-run on 10-metre Sentinel-2 imagery for the years the two records share: over the same window it finds about 2.6 times the park’s conversion rate, and about 4.5 times the ridge’s. Different instruments, same direction — where building is scattered, the long record sees roughly half of it.
Part nine
What the pictures cannot say
A satellite can tell you what got built and when. It cannot tell you whether it was legal. This story does not try to — and it is worth being clear about why nobody else can either, yet.
Building is not the same as breaking the law
The 1980 law put sixteen living villages inside the park on purpose. Their homes are lawful. Telling lawful village housing apart from encroachment needs land-ownership records — and those records are not public.
So these numbers measure construction. They do not measure crime.
Nobody has an accurate map of the park
The 1980 order describes the park partly by naming villages, without map coordinates. This study rebuilt about three-quarters of the boundary from that description. The government’s own surveyors, ordered by the High Court to mark the park on the ground, reached about 60 per cent and stopped — recording that the 1980 order gives them no land-record numbers to work from.
Even the official international register of protected areas turns out to hold a boundary for this park that sits about 11 kilometres west of the actual hills. Forty-five years after the promise, no one — not this study, not the government, not the international record — holds a complete, correct map of what was promised.
The technical details · testing the international boundary
The World Database on Protected Areas holds a shape for Margalla Hills (site 837, listed since 1980). The record reports 173.86 square kilometres, but the shape it carries covers only 99 — 57 per cent of its own claim. Laid over the hills, the shape overlaps them by 19 per cent; slid rigidly 11.5 kilometres east and 4.1 north, the overlap jumps to 53 per cent. That is the signature of a map digitised in the wrong place, not of a different park.
Nor is it a one-off: the same query returns Ayubia National Park at 33.7 square kilometres against its own shape’s 135. Both records are marked “State Verified”. The database’s terms forbid republishing its geometry, so the analysis repository carries only these measurements — plus the script that lets anyone re-download the shape and repeat the test.
That is the quiet ending of the story. The building can be measured from space, down to the year. The promise it happened inside of has never been fully drawn.
If you remember nothing else
The whole story in four lines
Since 1987, Islamabad has built over an area more than half the size of its national park — and almost none of it was in the hills.
About a quarter of the green strips along the main roads is gone. The road the cabinet chose to narrow in 2024 is not even among the twelve worst.
11,097 buildings stand inside the national park’s legal boundary, and nearly 1,300 on the ridge people believe is empty — which is now the fastest-filling place in the city.
Every figure is a minimum, and none is an accusation. Whether any of it was unlawful needs land records that nobody has published — and a park boundary that nobody, anywhere, has ever fully drawn.
Check the work
Everything behind this story is public
The code that fetched the images, drew the boundaries, dated every conversion and produced every figure — along with the full findings, the methodology and the documentary record — is open for anyone to inspect, re-run, or challenge. The repository ships with 270 automatic checks that pass on a fresh copy before a single satellite image is downloaded, so its numbers can be verified in minutes.
Found something wrong, or something to add — a dated photograph, a land record, a correction? That is exactly what it is there for.
github.com/wazeemlabs/islamabad-green-cover →For the curious
How this was done, in plain words
Free scientific satellite images (Landsat and Sentinel-2), one clear picture per year from 1987 to 2025. A patch of ground counts as newly built only if it changes and stays changed for four years. The results were checked against half a million building outlines, a re-run at three times the detail, and a second season of pictures. Where a check disagreed, the answer was corrected.
- Why every figure is a range
- Several fair cut-offs exist for “this is now a building”. All of them were run, and the range is what they agree on. The middle of a range is not more true than its edges.
- The biggest honest doubt
- Two respected international datasets disagree about how much of Islamabad is built up — by an area larger than the entire national park. Deciding what counts as “built” matters more than measuring it precisely.
- Why Google Maps was not used
- Its satellite view has no dates, is stitched from different years, and its terms forbid this kind of analysis. It is a navigation tool, not a measuring instrument.
- What is not claimed
- No individual is named and no offence is alleged. Where courts have ruled on specific sites, that is public court record, noted as such.
Sources: Landsat and Sentinel-2 imagery via the Microsoft Planetary Computer; building outlines from Microsoft and Google open research data; boundaries and road centrelines from OpenStreetMap; the 1980 park notification and the Islamabad High Court judgment in W.P. 4245/2014. Maps drawn directly from the study’s data, with relief from the Copernicus 30 m elevation model; the city map shades each 30-metre cell by the year its conversion was dated, on the highest of the three measures. Figures cover 1987–2022; 2023–25 cannot be confirmed yet because the four-year test needs time to close. All code, data recipes and fetched sources: github.com/wazeemlabs/islamabad-green-cover.